PyStPlot
PyStPlot is a VERY basic plotting tool for python that creates plots to be viewed in the web browser. It creates an html file that contain the plot data drawn with javascript and html canvas.
Why use PyStPlot?
PyStPlot is light and self contained. It has no external dependencies except for built in Python modules. It is not packed with features but ideal if you quickly want to make a plot on a system where no such libraries are installed. If you want an advanced plotting library then PyStPlot is not for you. But, if you want a lightweight plotting library that you can get up and running quickly without having to install extra dependencies, then use PyStPlot.
Install with pip
pip install pystplot
Usage
To plot a function, simply assign x and y values to two lists and call `pystplot.plot(...)`. Call either the `pystplot.show()` to create an output file and show it in the browser or `pystplot.save(...)` to just save the html file.
Functions
Plot
plot(x_list, y_list, property_string='-')
Creates the plot data.
	  Parameters:

	  x_list             list of values for x-axis
	  y_list             list of values for y-axis. Lists must be of same length
	  property_string    sets appearence of graph. Possible choices:
          'o'   points
          '-'   line
          'r'   red
          'b'   blue
          'g'   green
          'y'   yellow
          'm'   magenta
          'c'   cyan
          'w'   white
          'k'   black
Show
show()
Save
save(file_name=PLOT_FILE)
Saves an html-file with file name given as parameter. If no name is given the default "pystplot_output" is used.
	  Parameter:

	  file_name    string that contains file name of output html-file.
Subplot
subplot(rows, cols, index)
subplot(rows, cols, index)before plot(x_list, y_list, property_string='-') to tag the plot.
	  Parameters:

	  rows    number of rows in plot matrix
	  cols    number of columns in plot matrix
	  index   index of this specific plot - indexed from left to right.
Examples
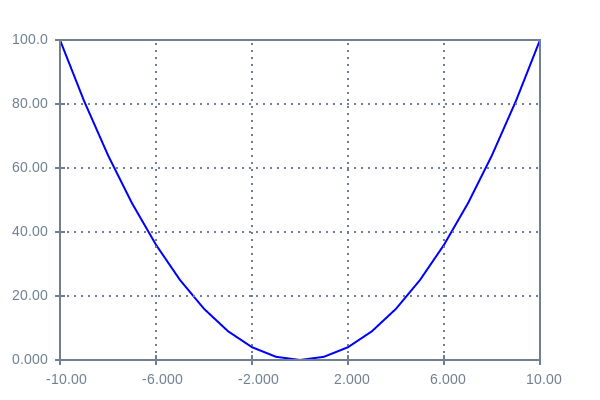
Simple Function Example
To plot a function, simply assign x and y values two two lists and call pystplot.plot(). The pystplot.show() function needs to be called to create an output file and show it in the browser.
	import pystplot as pl

	x_values = range(-10,11)
	y_values = [x*x for x in x_values]
	pl.plot(x_values, y_values)
	pl.show()
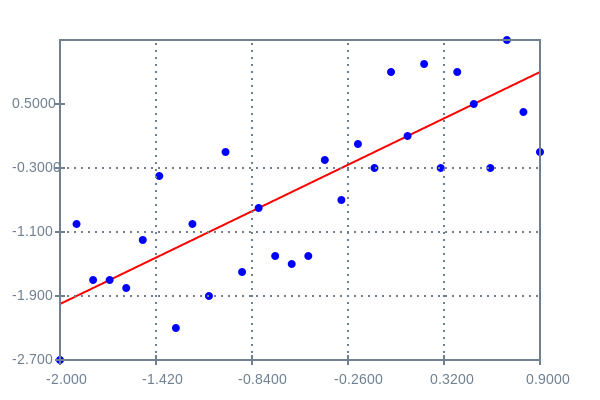
Scatterplot Example
Several lines of different types can be displayed in the same plot. The last argument of the plot function sets the display type. 'o' displays the data as filled dots.
	import pystplot as pl
	import math
	import random

	x_inds = range(-20,10)
	x_vals = [xi/10.0 for xi in x_inds]

	y_random = [x + random.randint(-10,10)/10.0 for x in x_vals]

	pl.plot(x_vals, x_vals,'-r')
	pl.plot(x_vals, y_random, 'o')

	pl.show()
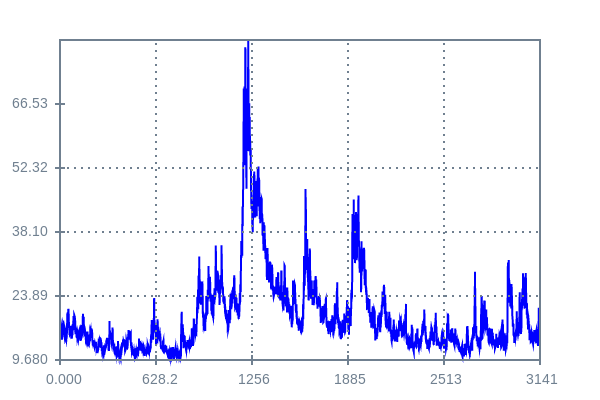
Time Series Example
Larger amounts of data can also be displayed
	import csv
	import pystplot as pl

	with open('time_series_data.csv', 'rb') as f:
	reader = csv.reader(f)
	all_rows = [row for row in reader]

	y_data =  [float(row[1]) for row in all_rows]
	x_vals = range(len(y_data))

	pl.plot(x_vals, y_data)
	pl.show()
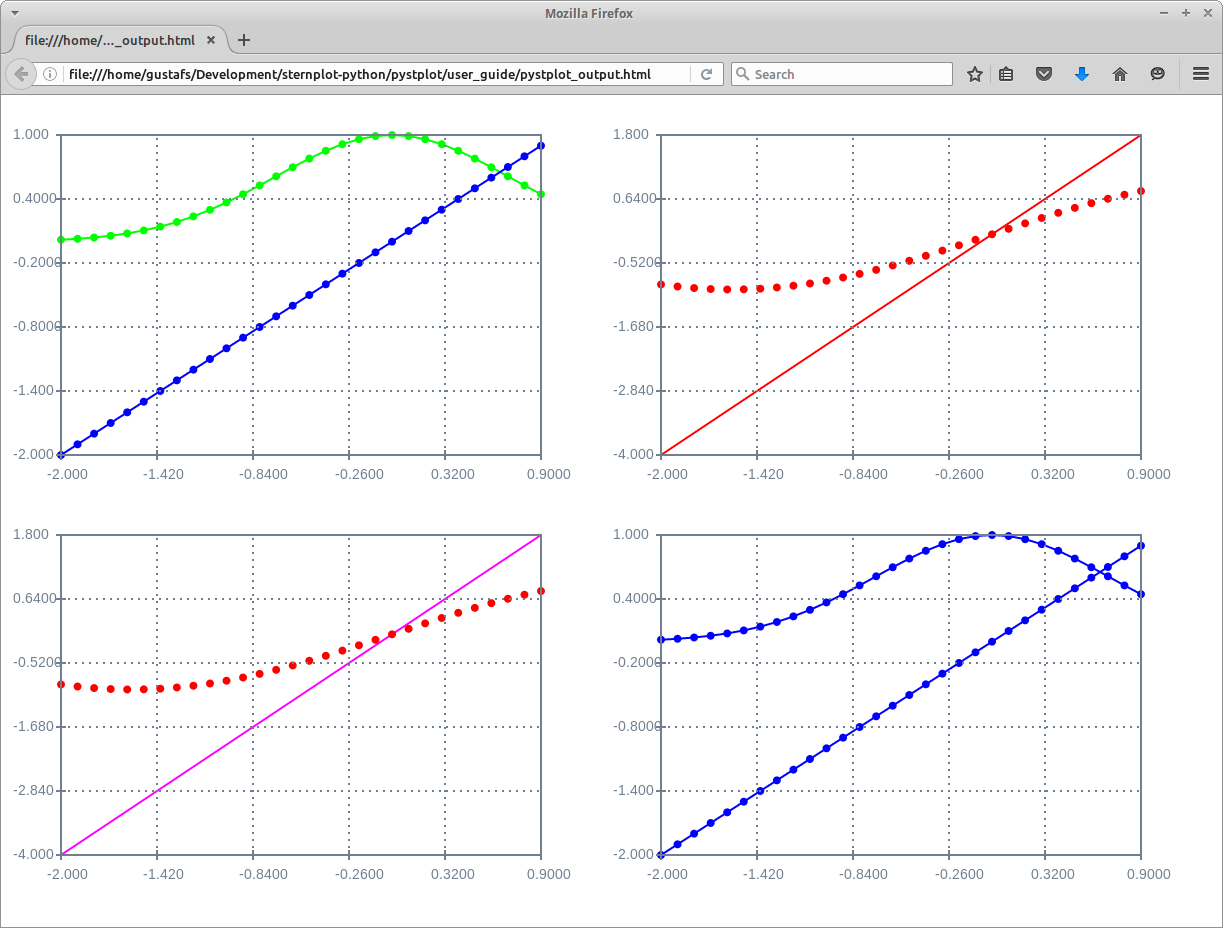
Subplot Example
To create several plots together use the subplot function. This creates a matrix of plots in a Matlab/Matplotlib manner. Call subplot(rows, cols, index)before plot(x_list, y_list, property_string='-') to tag the plot.
	import pystplot as pl
	import math

	x_inds = range(-20,10)
	x_vals = [xi/10.0 for xi in x_inds]
	y_vals = [math.exp(-x*x) for x in x_vals]
	sin_vals =  [math.sin(x) for x in x_vals]
	x2 = [2*x for x in x_vals]

	pl.subplot(2,2,1)
	pl.plot(x_vals, y_vals, '-og')
	pl.plot(x_vals, x_vals, '-o')

	pl.subplot(2,2,2)
	pl.plot(x_vals, x2,'-r')
	pl.plot(x_vals, sin_vals,'ro')

	pl.subplot(2,2,3)
	pl.plot(x_vals, x2,'-m')
	pl.plot(x_vals, sin_vals,'ro')

	pl.subplot(2,2,4)
	pl.plot(x_vals, y_vals, '-o')
	pl.plot(x_vals, x_vals, '-o')

	pl.show()